Chart Pro Plugin
Overview
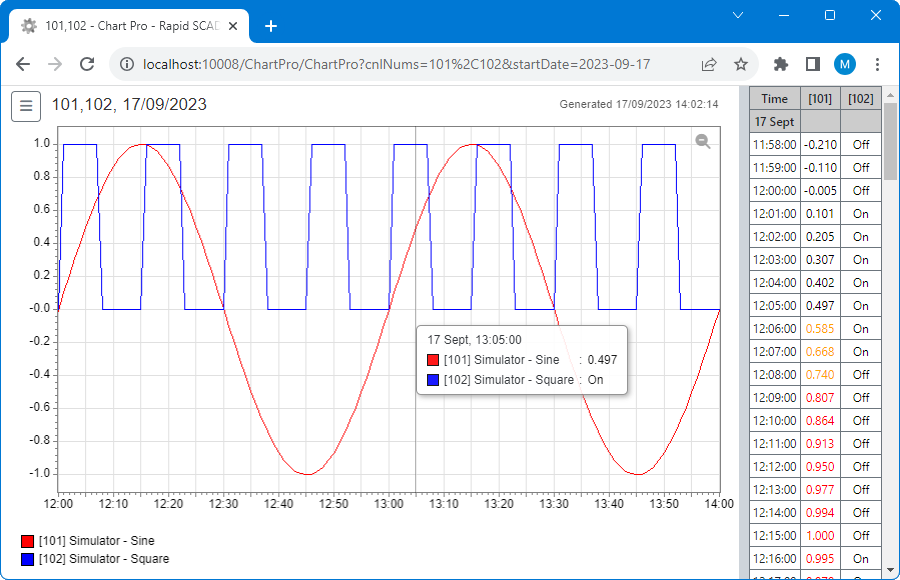
Chart Pro Plugin is the additional plugin for the Webstation application extends the capabilities of Rapid SCADA charts: adds scaling, displaying of multiple charts, export to PNG and PDF. Download the plugin using the link. The appearance of Chart Pro Plugin is shown in the following figure.
Installation
Chart Pro Plugin is installed according to the instructions. Follow additional steps during installation:
-
Copy the
PlgChartPro.xmlandPlgChartPro_Config.xmlfiles into your project. ThePlgChartPro_Reg.xmlfile will be created when the registration key is saved.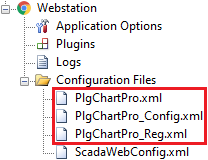
-
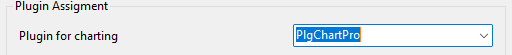
In the Webstation application options, in the Plugin Assignment section, select the PlgChartPro plugin.
Configuring
Chart Pro Plugin is configured by default. Plugin settings are saved in the PlgChartPro.xml and PlgChartPro_Config.xml files, which can be edited manually if necessary.
The PlgChartPro_Config.xml file contains a list of profiles. A profile is a set of plugin settings that can be selected by a user on the chart web page. The PlgChartPro.xml file contains a chart profile, which includes display options and data options.
To create a new profile, copy the PlgChartPro.xml file with a new name and edit it. Then specify the created profile in the PlgChartPro_Config.xml file.
In addition to the configuration files, the chart display is determined by a query string, which parameters are given in the table below. The query string has the following form: http://localhost:10008/ChartPro/ChartPro?cnlNums=101-103&startDate=2023-09-16&mode=fixed&period=2&periodMin=60&title=Demo&profile=PlgChartPro.xml
| Parameter | Data Type | Description |
|---|---|---|
| cnlNums | Range of integers separated by hyphens and commas | Channel numbers displayed on the chart |
| startDate | Date in YYYY-MM-DD format | Start date of the displayed data. If not specified, the current date is used |
| mode | fixed | rolling | Chart mode: fixed or rolling. If not specified, fixed mode is used |
| period | Integer | Chart period in days relative to the start date. Can be either positive or negative. Used in fixed mode |
| periodMin | Integer | Chart period in minutes in rolling mode |
| title | String | Chart title. If not specified, it is generated automatically |
| profile | String | Chart profile file name. If not specified, the first profile from the list is used |
In the fixed mode, the plugin displays a chart for a selected period of time. The chart data is automatically updated by adding new values to the right side of the chart.
In the rolling mode, the plugin displays a graph from the current moment to the specified depth. The chart data is automatically updated, while the chart shifts from right to left.
The following figure helps to understand the layout of the chart in order to change the plugin configuration.

View Mode
Chart Pro Plugin supports the view mode, in which a chart node is added to the view tree of Webstation. To display the chart as a view, add the following row to the Views table:
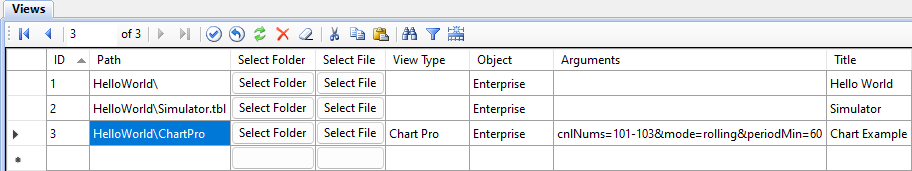
The Path field contains the path in the view tree. The View Type field should be set to Chart Pro. The view arguments correspond to the query string parameters described above.