Table Views
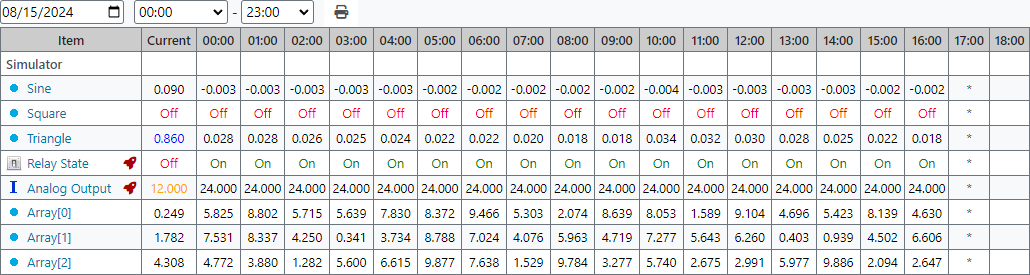
A table view (see Figure 1) is designed to display historical data for a day with a specified period, as well as current data. Clicking a table item opens a chart of the channel associated with the item. The  button brings up a dialog for sending a command.
Creating and Editing
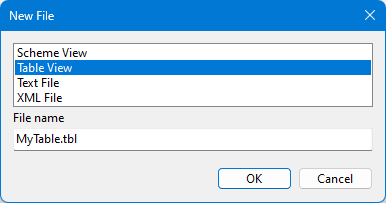
One of the advantages of table views is that they are easy to create. Navigate to the Views section of a project, right-click on the desired folder and select New File from the context menu. In the dialog box that opens (see Figure 2), select the Table View type, specify a file name and click OK. The created file will appear in the project explorer. Double-clicking opens the view in Table Editor (see Figure 3).
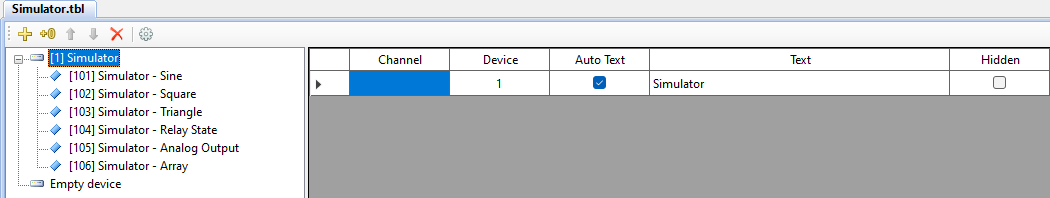
The left panel of the editor contains a list of channels grouped by devices. The main part of the window displays the contents of the table view. Each view item is associated with a device or channel. To add an item to the view, select the corresponding tree node in the left pane, then click the  button, press Enter, or double-click the tree node. The
 ![]() button adds an empty line. If the configuration database has changed, click the
button adds an empty line. If the configuration database has changed, click the  button located on the application toolbar to refresh devices and channels.
If the Auto Text checkbox is checked for a view item, the device or channel name is automatically used as the item's text. If this name is later changed in the configuration database table, there is no need to update the view.
The Hide checkbox removes an item from the displayed table. However, the channel numbers corresponding to the hidden element continue to be used by the event filter by view.
After creating a table view, it must be registered in the configuration database in the Views table, as described in the previous article.
View Options
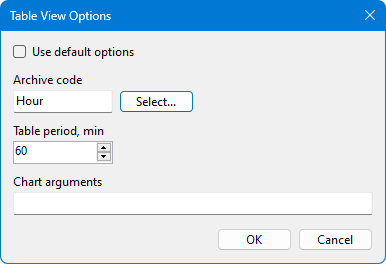
A window containing the table view options (see Figure 4) is called by the  button located on the editor toolbar. The options are set for the certain view being edited.
| Option | Description |
|---|---|
| Archive code | Specifies the archive from which historical data is retrieved |
| Table period | Time step used to generate the table view columns |
| Chart arguments | Arguments separated by & that are added to the address bar when a chart opens |
Example of arguments for the standard Chart plugin: archive=Min&gap=90, where archive is the archive code, gap is the distance between points connected by a line (in seconds).
Example of arguments for Chart Pro Plugin: profile=PlgChartPro.xml, where profile is the name of the chart profile file.
If the Use default options checkbox is checked, the archive code and period are loaded from the web application configuration file ScadaWebConfig.xml. The TableArchiveCode and TablePeriod options located in the Main group of the CustomOptions section are used.